News & Op-Ed Commentary from The People's Republic of Moscow (Idaho)
FAIL: NOAA’s winter climate outlook claimed ‘warmer than normal’ temperature
01/07/2018
The climate experts want us to think that they know what the weather is going to be like 80 years from now, when they cannot even predict what it will look like two months in advance.
Global warming/climate change advocates want us to believe that computer models will accurately predict temperature out to the year 2100, yet NOAA, which uses computer models to predict the next seasonal outlook, couldn’t even get that right. The north, northeast, and deep south have been in a deep freeze, with blizzard like conditions, and well below normal temperatures. Temperature records have fallen all over the eastern half of the USA in the last two weeks. Meanwhile, advocates of global warming/climate change certainty, such as Al Gore and Michael Mann, took advantage of the cold snap and said have said “that’s exactly what we should expect from the climate crisis“.
Meanwhile, back in the real world, reality bites for NOAA’s short term climate prediction.
From climate.gov, excerpts of their prediction in October.
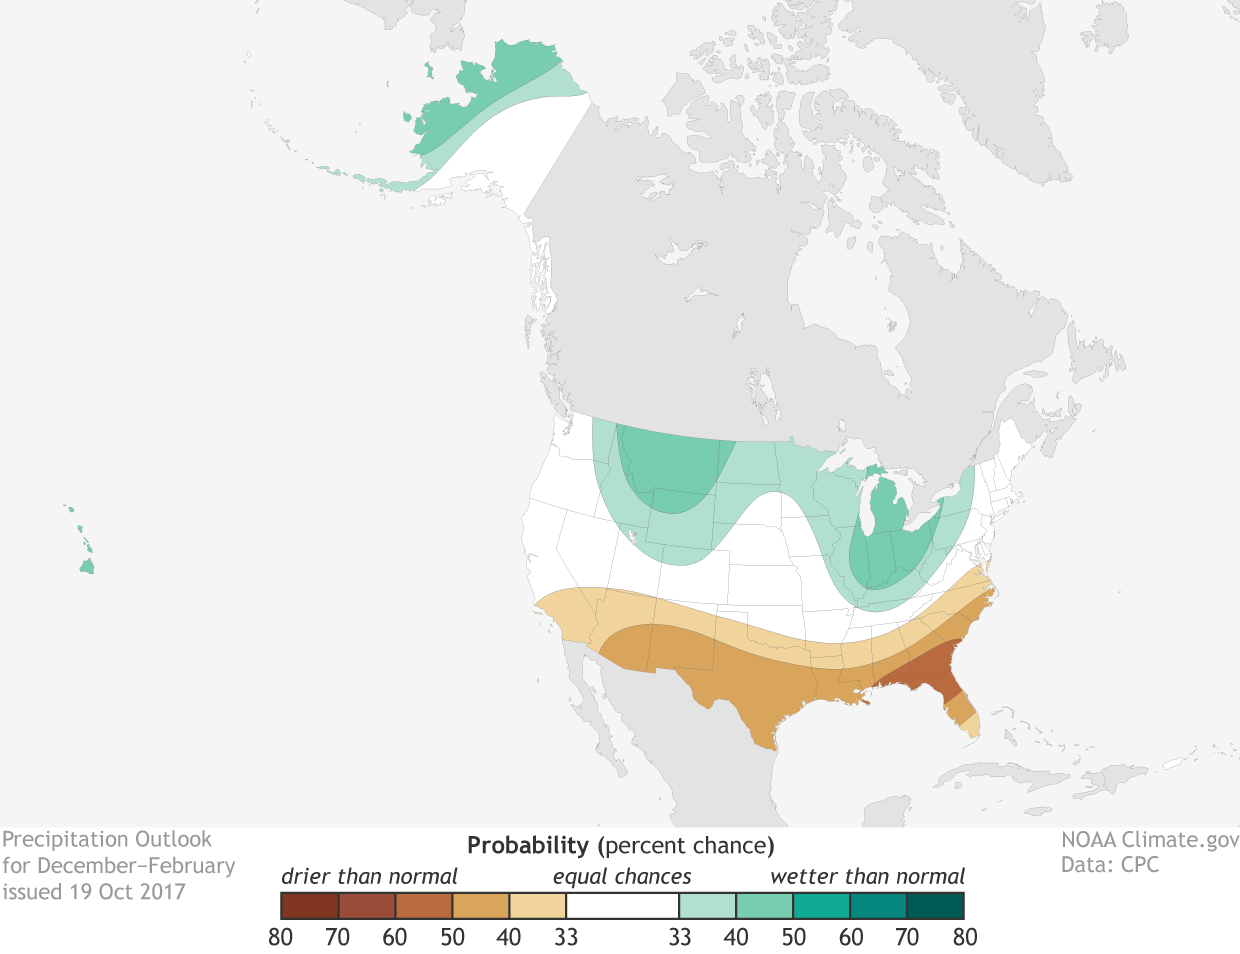
Both the temperature and precipitation outlooks lean on typical La Niña impacts, particularly those of the past 30 years, and bear some resemblance to the outlooks issued for last winter (not surprisingly since the forecast guidance is similar – more on that below). In the image above, the winter precipitation outlook favors below-normal precipitation across the entire southern U. S., with probabilities greatest (exceeding 50%) along the eastern Gulf Coast to the coasts of northern Florida, Georgia, and southern South Carolina. In contrast, above-average precipitation is more likely across much of the northern parts of the country, in the northern Rockies, around the Great Lakes, in Hawaii, and western Alaska.
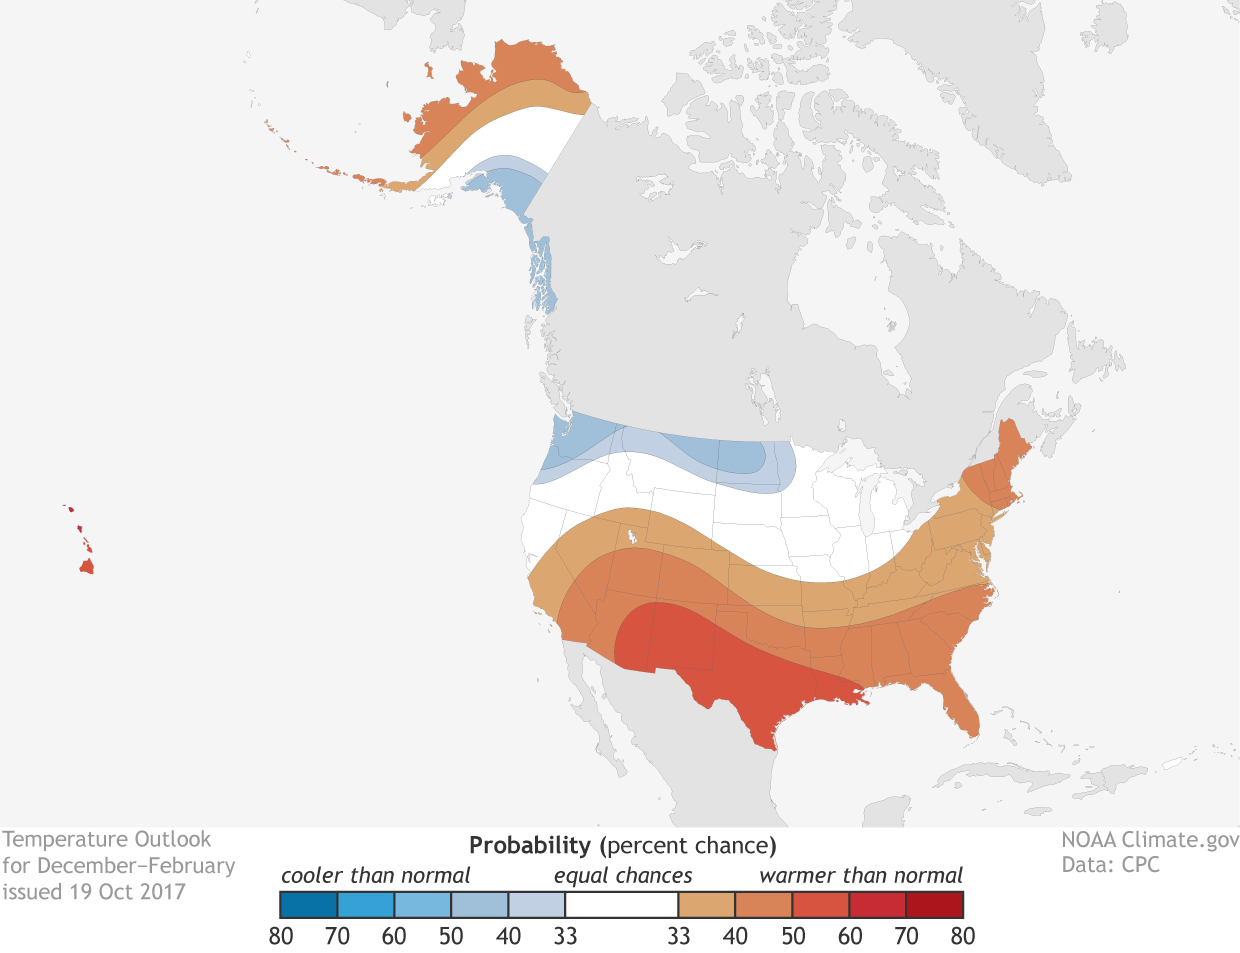
Places where the forecast odds favor a much colder than usual winter (blue colors) or much warmer than usual winter (red), or where the probability of a cold winter, a warm winter, or a near-normal winter are all equal (white). The darker the color, the stronger the chance of that outcome (not the bigger the departure from average). Click image for version that includes Alaska and Hawaii. NOAA Climate.gov map, based on data from NOAA CPC.
The temperature outlook shown above indicates above-average temperatures across the southern US, extending northward out West through the central Rockies and all the way up to Maine in the eastern part of the nation. Above-average temperatures are also favored in Hawaii and in western and northern Alaska. Chances are greatest in an area extending from the desert Southwest to central and southern Texas and Louisiana (greater than 50%).
Probabilities are tilted toward colder-than-normal temperatures along the northern tier from the Pacific Northwest to Minnesota and also in southeastern Alaska. However, the likelihood of below-average temperatures across the North is modest, with no probabilities in these regions reaching 50%.
…
Places where the forecast odds favor a much drier than usual winter (brown colors) or much wetter than usual winter (blue-green), or where the probability of a dry winter, a wet winter, or a near-normal winter are all equal (white). The darker the color, the stronger the chance of that outcome (not the bigger the departure from average). Click image for version that includes Alaska and Hawaii. NOAA Climate.gov map, based on data from NOAA CPC.